00:00 IST

BU Dashboard

Smart, customizable dashboard for managing classroom insights, assignments, and learning progress

BU Dashboard

OVERVIEW

Improving Classroom Decision-Making Through a Customizable Data Experience. This project redesigns the main dashboard for Benchmark Education — a digital platform used by K–5 teachers to manage literacy instruction, assessments, and classroom resources. The goal was to transform the dashboard from a static information page into a flexible, insight-driven workspace where teachers can quickly understand student progress and manage daily classroom tasks.

INDUSTRY

EdTech

ROLE AND DURATION

UI Design

2024

CLIENT

BU Logo_

The Problems

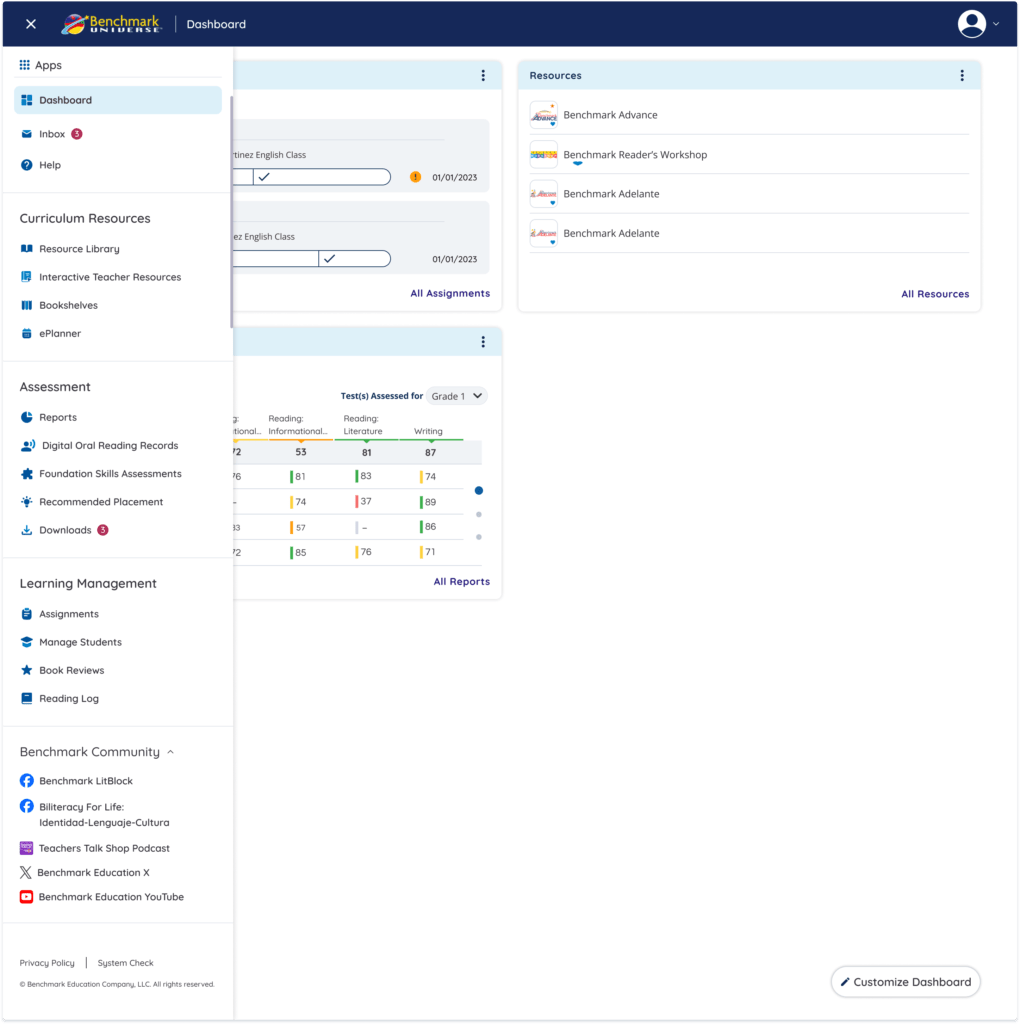
Teachers interact with multiple tools daily — assignments, assessments, reports, and resources. However, the existing dashboard presented information in a fixed layout with limited prioritization, forcing teachers to:

  • Navigate multiple sections to find important information
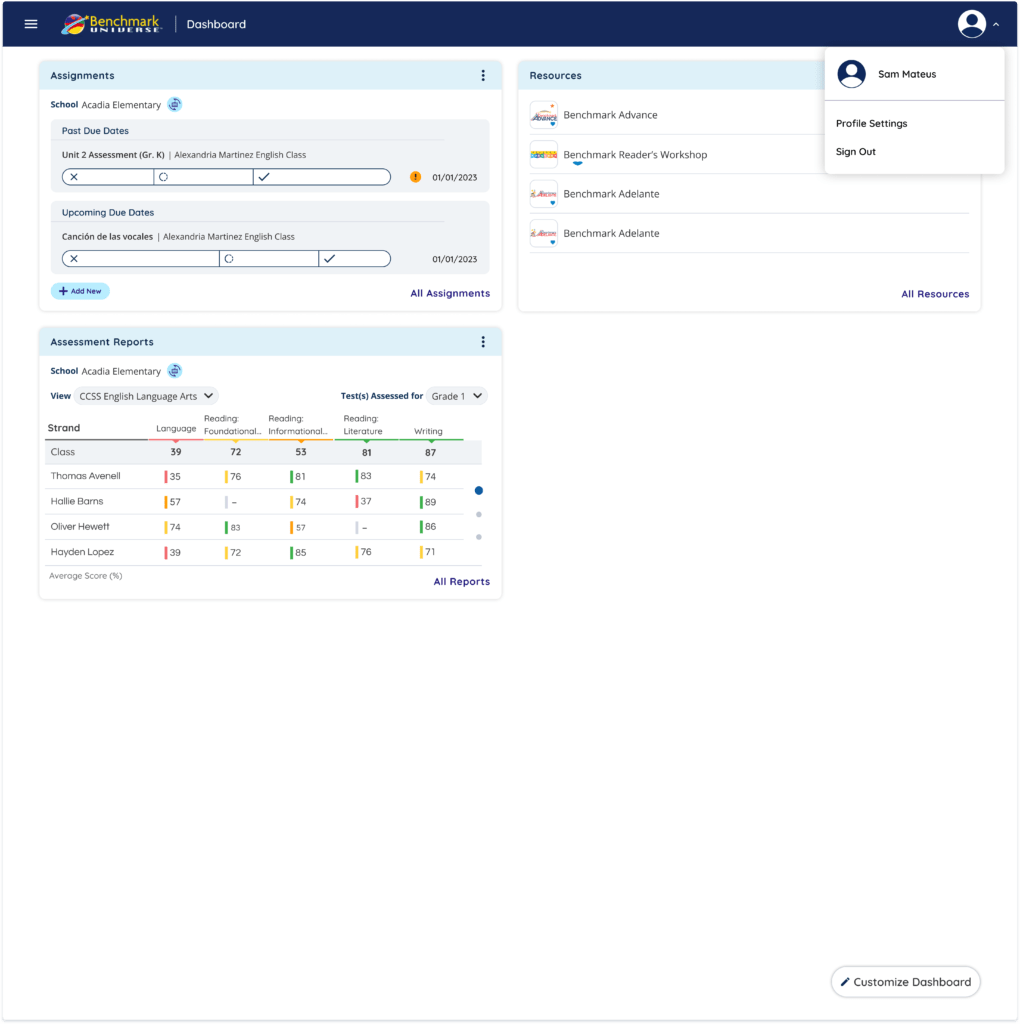
  • Scan dense reports before identifying struggling students
  • Adapt their workflow around the system rather than the system adapting to them

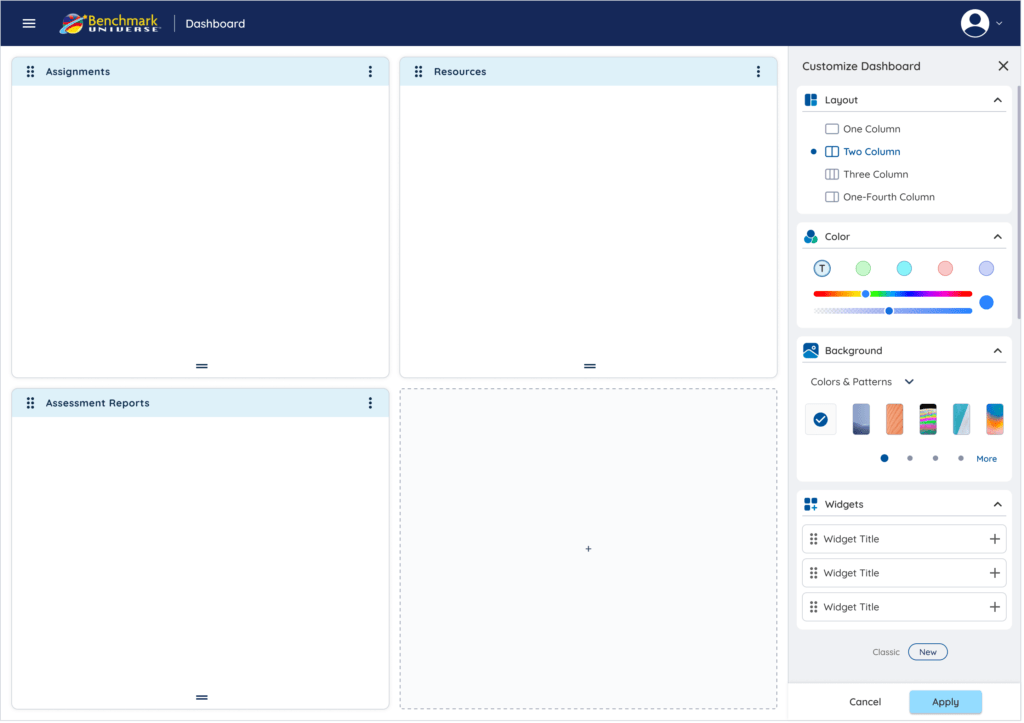
From a UX perspective, the dashboard lacked:

  • Personalization
  • Information hierarchy
  • Task-focused workflows

This created friction during critical moments such as lesson preparation or student intervention planning.

The Opportunity

Teachers manage classrooms differently depending on:

  • Grade level
  • Curriculum focus
  • Student needs
  • District requirements

A single static dashboard could not support all workflows.
The opportunity was to design a modular dashboard system where teachers could:

  • Prioritize the tools they use most
  • Rearrange information based on their workflow
  • Access insights faster

My Role

Responsibilities included:

  • Product discovery
  • UX strategy
  • Information architecture
  • Dashboard interaction design
  • Widget system design
  • High-fidelity UI
  • Developer collaboration during implementation

Solution

I redesigned the dashboard using a modular widget-based layout.

Each section of the dashboard became a separate card or widget, such as:

  • Assignments
  • Resources
  • Assessment Reports

This makes the dashboard easier to scan and navigate.

Homepage

A side panel for quick customization, enabling users to adjust layout, widgets, and appearance without leaving the dashboard.

Menu

A simplified and well-structured navigation system that improves discoverability, reduces cognitive load, and enables faster task switching across the platform.

Seamless Account Access

A simple profile menu for quick access to account settings and actions.

Customizable Dashboard

One of the key improvements was adding a Customize Dashboard feature.

Teachers can now:

  • Choose different dashboard layouts
  • add or remove widgets
  • rearrange dashboard sections
  • personalize the dashboard appearance

This allows teachers to organize their workspace based on their own teaching workflow.

Navigation Improvements

The platform navigation was organized into clearer categories:


Curriculum Resources

  • Resource Library
  • Interactive Teacher Resources
  • Bookshelves

Assessment

  • Reports
  • Reading Records
  • Placement Tools

Learning Management

  • Assignments
  • Manage Students
  • Reading Logs

This structure helps teachers find tools faster.

Impact

The redesigned dashboard improves the experience by:

  • making information easier to scan
  • reducing navigation time
  • allowing teachers to personalize their workspace
  • helping teachers understand student progress faster

What I Learned

This project reinforced that:

  • dashboards should prioritize clarity over complexity
  • customization helps support different user workflows
  • presenting data visually improves decision-making
Scroll to Top